KoolReport's Forum

Official Support Area, Q&As, Discussions, Suggestions and Bug reports.
Forum's Guidelines

Linebreak in Colmnlabel and count inside the columnbar #1660

Closed Thomas opened this topic on on Oct 12, 2020 - 3 comments

Thomas commented on Oct 12, 2020

I have a column chart (Chartjs) with 3 datasets.

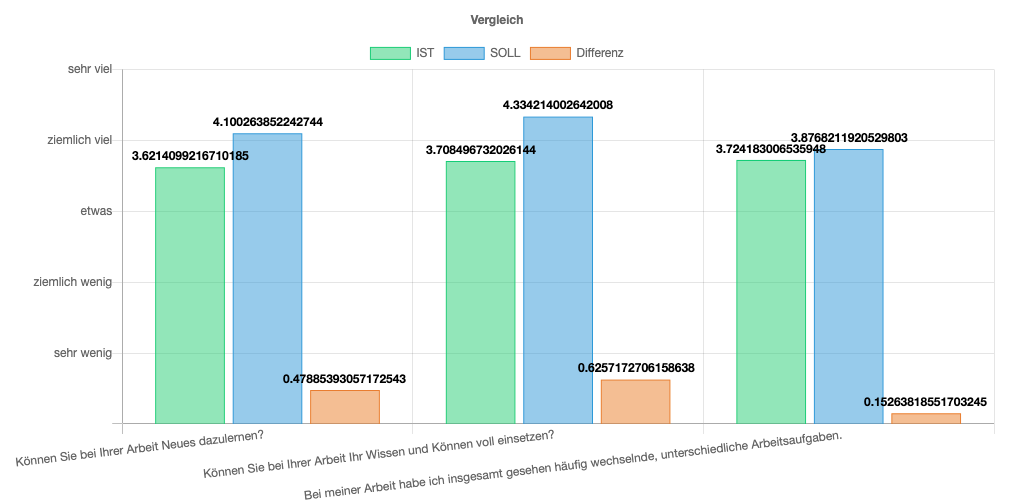
  1. How is it possible to have a auto line break, to have the same font-size but in multiple rows.
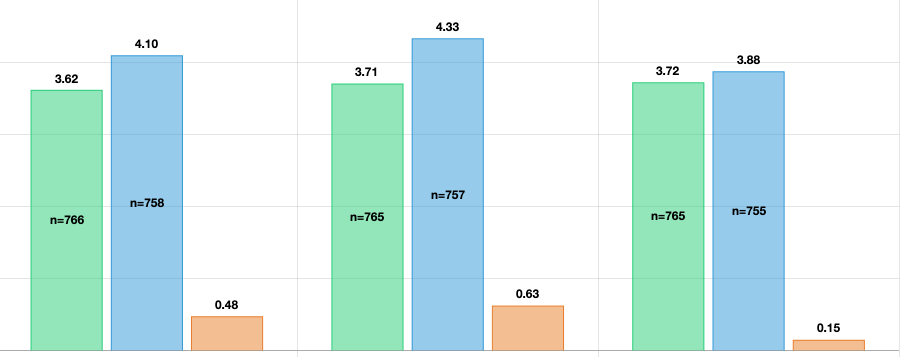
  2. I would like to have an additional data label (count of the answers = 'group_0_a_count', 'group_0_b_count') inside the blue and green column.
\koolreport\chartjs\ColumnChart::create(array(
            "title"=>"Vergleich",
            "plugins"=>array("datalabels"),
            "dataSource"=>$groups_data_main_survey_object->whereIn('title', array('AT01','AT02','AT03'))->toArray(),
            "columns"=>array(
                "question",
                "group_0_a_avg" => array(
                    "label" => $label_avalues,
                    "decimals" => '2',
                    "type"=>"number",
                    "config"=>array(
                        )
                ),
                "group_0_b_avg"=>array(
                    "label" => $label_bvalues,
                    "decimals" => '2',
                    "type"=>"number"
                ),
                "group_0_difference_avg"=>array(
                    "label" => $label_values_difference,
                    "decimals" => '2',
                    "type"=>"number"
                ), 
                        
            ),
            "colorScheme"=>array(
                        "#2ecc71",        
                        "#3498db",
                        "#e67e22"
                )
            ,
            "options"=>array(
                "plugins"=>array(
                    "datalabels"=>array(
                        "labels"=> array(
                            "values"=> array(
                                "color"=> "black",
                                "decimals" => '2',
                                "anchor" => "end",
                                "offset"=>"0",
                                "align"=>"top",
                                "font"=>array(
                                    "size"=>"12",
                                    "weight" => "bold",
                                )
                            ),
                        ),
                        "formatter" => "function(value, context) {
                                        return round(value, 2)"
                        
                        
                    )
                ),
                "scales" => array(                    
                    "yAxes" =>  array(
                        array(
                            "ticks" => array(
                                "min"=>0,
                                "max"=> 5,
                                "stepSize"=> 1,
                                "suggestedMin"=> 0.5,
                                "suggestedMax"=> 5.5,
                                "callback" => "function(label, index, labels) {
                                    switch (label) {
                                    case 0:
                                        return '';
                                    case 1:
                                        return '$scale_answer_1';
                                    case 2:
                                        return '$scale_answer_2';
                                    case 3:
                                        return '$scale_answer_3';
                                    case 4:
                                        return '$scale_answer_4';
                                    case 5:
                                        return '$scale_answer_5';
                                    }
                                }"

                            )                            
                        )
                    )
                ),           
            ),
        ));
KoolReport commented on Oct 14, 2020

I will forward this case to dev.team if they have solution. I will get back to you.

Thomas commented on Oct 14, 2020

Okay, with the callback function it is possible to alter the label. That I will figure out myself.

But I don't see where to begin on the second topic.

Thomas commented on Oct 15, 2020

It is possible to use the multiple datalabels. With the formatter and php I managed to get the numbers inside the columns. In case someone wants to reproduce it. Here is the code and chart:

"datalabels"=>array(
                        "labels"=> array(
                            "values"=> array(
                                "color"=> "black",
                                "decimals" => '2',
                                "anchor" => "end",
                                "offset"=>"0",
                                "align"=>"top",
                                "font"=>array(
                                    "size"=>"12",
                                    "weight" => "bold",
                                ),
                                "formatter" => "function(value, context) {
                                        var result = value.toFixed(2);
                                        return result;
                                    }"  
                            ),
                            "nvalues"=> array(
                                "color"=> "black",
                                "decimals" => '2',
                                "anchor" => "center",
                                "offset"=>"0",
                                "align"=>"center",
                                "font"=>array(
                                    "size"=>"12",
                                    "weight" => "bold",
                                ),
                                "formatter" => "function(value, context) {
                                    var ngroupa = ['$get_answer_a_count_array[0]','$get_answer_a_count_array[1]','$get_answer_a_count_array[2]'];
                                    var ngroupb = ['$get_answer_b_count_array[0]','$get_answer_b_count_array[1]','$get_answer_b_count_array[2]'];   
                                    switch (context.datasetIndex) {
                                            case 0:
                                                return 'n=' + ngroupa[context.dataIndex];
                                            case 1:
                                                return 'n=' + ngroupb[context.dataIndex];
                                            case 2:
                                                return '';
                                            }
                                    }"  
                            ),
                            
                        ),
                        
                    ),

Build Your Excellent Data Report

Let KoolReport help you to make great reports. It's free & open-source released under MIT license.

Download KoolReport View demo
help needed
solved

ChartJS