KoolReport's Forum
Official Support Area, Q&As, Discussions, Suggestions and Bug reports.
Forum's Guidelines
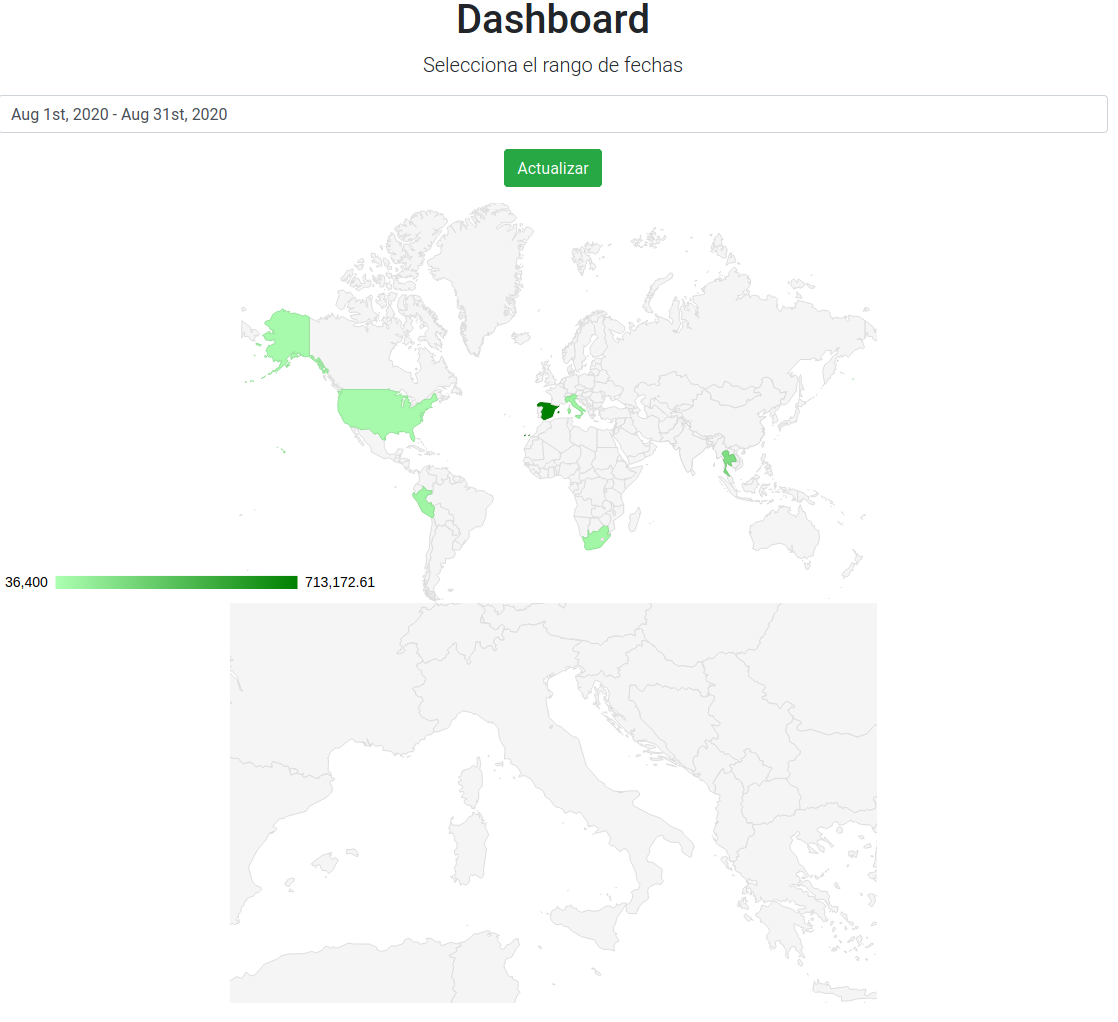
GeoChart Markers not working #1606
Hi David,
Test.view.php
<?php
    use \koolreport\widgets\google\GeoChart;
    use \koolreport\inputs\Select2;
    use \koolreport\clients\Bootstrap;
    use \koolreport\inputs\DateRangePicker;
?>
<div class="report-content">
    <div class="text-center">
        <h1>Dashboard</h1>
        <p class="lead">Selecciona el rango de fechas</p>
    </div>
    <form method="post">
        <div class="row">
            <div class="col-md-12">
                <div class="form-group">
                <?php
                DateRangePicker::create(array(
                    "name"=>"dateRange"
                ))
                ?>
                </div>
                <div class="form-group text-center">
                    <button class="btn btn-success"><i class="glyphicon glyphicon-refresh"></i> Actualizar</button>
                </div>
            </div>
        </div>
    </form>
<?php
if($this->dataStore("sales")->countData()>0)
    {

    GeoChart::create(array(
        "dataStore"=>$this->dataStore("sales"),
        "columns"=>array(
            "country"=>array(
                "label"=>"País"
            ),
            "ingresos"=>array(
                "label"=>"Ingresos",
                "type"=>"number",
                "suffix"=>"$"
            ),
            "tn"=>array(
                "label"=>"Tn",
                "type"=>"number",
                "suffix"=>"Tn"
            )
        ),
        "width"=>"100%",
        "options"=>array(
            "region"=>'world',
            "displayMode"=>'auto',
            "showTooltip"=> true,
            "showInfoWindow"=> true,
            "colorAxis" => ["colors"=> ['#adffb2','green']]
        )
    ));
    GeoChart::create([
    "title"=>"World Polulation 2016",
    "dataSource"=>[
        ['City',   'Population', 'Area'],
        ['Rome',      2761477,    1285.31],
        ['Milan',     1324110,    181.76],
        ['Naples',    959574,     117.27],
        ['Turin',     907563,     130.17],
        ['Palermo',   655875,     158.9],
        ['Genoa',     607906,     243.60],
        ['Bologna',   380181,     140.7],
        ['Florence',  371282,     102.41],
        ['Fiumicino', 67370,      213.44],
        ['Anzio',     52192,      43.43],
        ['Ciampino',  38262,      11]
    ],
    'mapsApiKey'=> 'your-google-key-map',
    "options"=>[
        "region"=>'IT',
        "displayMode" => 'markers',
        "colorAxis" => ["colors"=> ['green', 'blue']]
    ]
]);
}else{
    ?>
        <div class="alert alert-warning">
            <i class="glyphicon glyphicon-info-sign"></i> Lo sentimos. No hay datos para mostrar en las fechas seleccionadas.
        </div>
<?php
    }
?>
</div>
Test.php
<?php

// Require autoload.php from koolreport library
require APPPATH."../vendor/autoload.php";

//Define the class
class Test extends \koolreport\KoolReport{
    use \koolreport\codeigniter\Friendship;
    use \koolreport\inputs\Bindable;
    use \koolreport\inputs\POSTBinding;

    protected function defaultParamValues(){
        return array(
            "dateRange"=>array(
                date("Y-m-01"),
                date("Y-m-d")
            ),
        );
    }

    protected function bindParamsToInputs(){
        return array(
            "dateRange"=>"dateRange",
        );
    }

    public function setup()
    {
///producto final
        $this->src('default')
        ->query("SELECT countries.name country, SUM(kg)/1000 tn ,SUM(kg*pu) ingresos FROM ventas JOIN clientes ON ventas.cliente=clientes.CodCliente JOIN countries ON clientes.country=countries.id WHERE fecha BETWEEN :start AND :end GROUP BY countries.id ")
        ->params(array(
            ":start"=>$this->params["dateRange"][0],
            ":end"=>$this->params["dateRange"][1]
        ))
        ->pipe($this->dataStore('sales'));

    }
}
the output is:
Thanks Regards
This is strange. I copy your 2nd Geochart code which has displayMode=markers and put in our Google maps api key. The geochart shows markers well. Please try to retrieve a new maps api key:
https://developers.google.com/maps/documentation/geocoding/get-api-key
Then put it in this line of your geochart code:
'mapsApiKey'=> $yourNewMapsApiKey, //
Let us know the result. Thanks!
Hi,
We've received your maps api key via email and tested it. Checking developer tool console we find that the reason the marker geochart doesn't work with your api keys is because of this error:
Google Maps JavaScript API error: ApiNotActivatedMapError
Please following this error code documentation to enable the Maps JavaScript API under APIs in the Google Cloud Platform Console first:
Then try Geochart again to see if it works. Thanks!
Build Your Excellent Data Report
Let KoolReport help you to make great reports. It's free & open-source released under MIT license.
Download KoolReport View demo