KoolReport's Forum

Official Support Area, Q&As, Discussions, Suggestions and Bug reports.
Forum's Guidelines

Undefined index & array_merge(): Expected parameter 1 to be an array, null #1534

Open Ruth Cano opened this topic on on Jul 16, 2020 - 3 comments

Ruth Cano commented on Jul 16, 2020

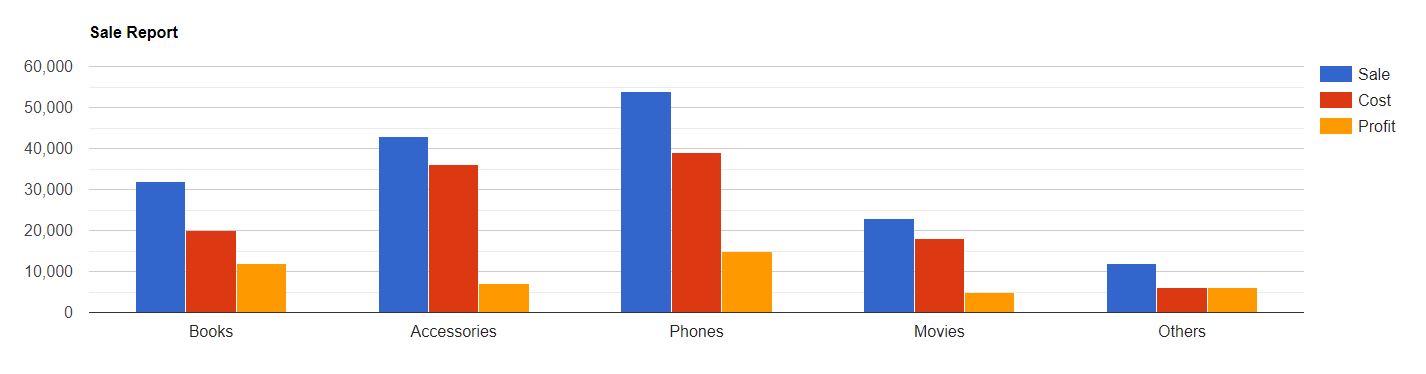
Hi. I have a problem rendering a graph and a table with data from a query.

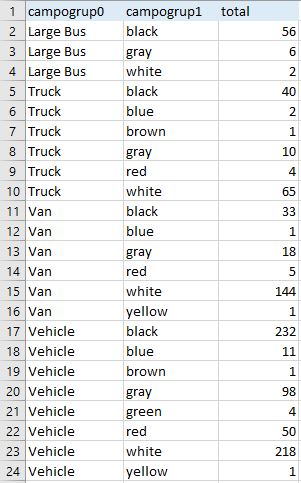
The query returns rows that I need in columns for KoolReport render, so I put that rows in an array to get de columns. This is the result array:

$dataSrc = array(
        array("category"=>"LargeBus","black"=>100,"blue"=>50),
        array("category"=>"Truck","black"=>50,"blue"=>60,"brown"=>30),
        array("category"=>"unknown","unknown"=>8000),
        array("category"=>"Van","black"=>25,"blue"=>20),
        array("category"=>"Vehicle","black"=>110,"blue"=>95,"brown"=>70),
    );

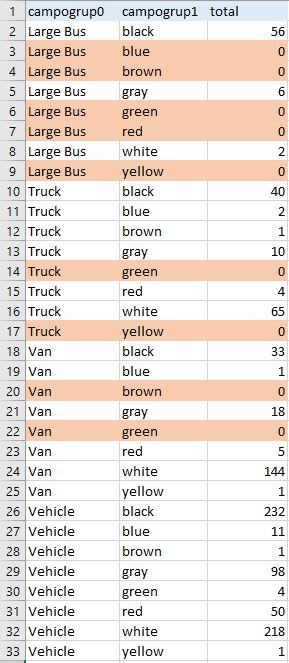
The problem is that I haven't all the columns for all the categories and I don't know how to create the params for the chart to get something like I have the categories that not appearing with value 0.

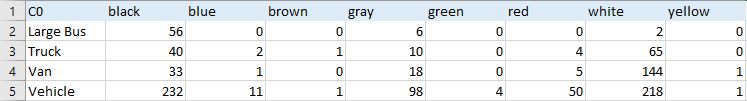
I've create the "columns" array I need to create de chart, with all the columns: "black", "blue", "brown", "unknown", but in "\vendor\koolreport\core\src\widgets\google\Chart.php" I get two errors in line 157: "Undefined index" and "array_merge(): Expected parameter 1 to be an array, null". The code of this line is: $columns[$cKey] = array_merge($meta["columns"][$cKey], $cValue);

I think it could be cause $meta["columns"][$cKey] is empty because the row of $dataSrc hasn't that key and the merge not put $cValue into $columns[$cKey].

I don't know how to resolve or how I have to do this to render $dataSrc.

Thank you.

KoolReport commented on Jul 19, 2020

So you mean your data is not standard, some column may be missing.

Ruth Cano commented on Jul 22, 2020

I'll try to explain what I have to do.

I have the next query:

SELECT vt.name AS campogrup0, vc.name AS campogrup1, count(*) AS total FROM detection dt inner join vehicle_type vt on dt.vehicle_type_id = vt.id inner join vehicle_color vc on dt.color_id = vc.id WHERE dt.datetime_utc between '2020-05-01 00:00:00' AND '2020-05-03 23:59:59' AND dt.vehicle_type_id IS NOT NULL AND dt.color_id IS NOT NULL GROUP BY campogrup0, campogrup1 ORDER BY campogrup0, campogrup1

And this is the result:

What I need is to get all the colors for each vehicle type, if some vehicle type hasn't any color the count has to be 0, that is, something like this:

Finally, I need to transpose rows into columns to get this:

Can you tell me how can I get all of this to paint a graph with vehicle type in x-axis and group by colors to get this kind of column chart?

Thank you.

David Winterburn commented on Jul 27, 2020

Please try our Cube process to group your data into a table format:

https://www.koolreport.com/docs/cube/cube_process/

Build Your Excellent Data Report

Let KoolReport help you to make great reports. It's free & open-source released under MIT license.

Download KoolReport View demo
help needed

None