KoolReport's Forum

Official Support Area, Q&As, Discussions, Suggestions and Bug reports.
Forum's Guidelines

Drilldown to support array data instead of sql query? #1494

Open ankit raj opened this topic on on Jun 19, 2020 - 2 comments

ankit raj commented on Jun 19, 2020

Hi, i am creating a drilldown based on array data source instead of sql data source because i previously get all the values so that drilldown is fast,which is exactly similar to this example:

This is my code:

 \koolreport\drilldown\DrillDown::create(array(
        "name"=>"saleDrillDown",
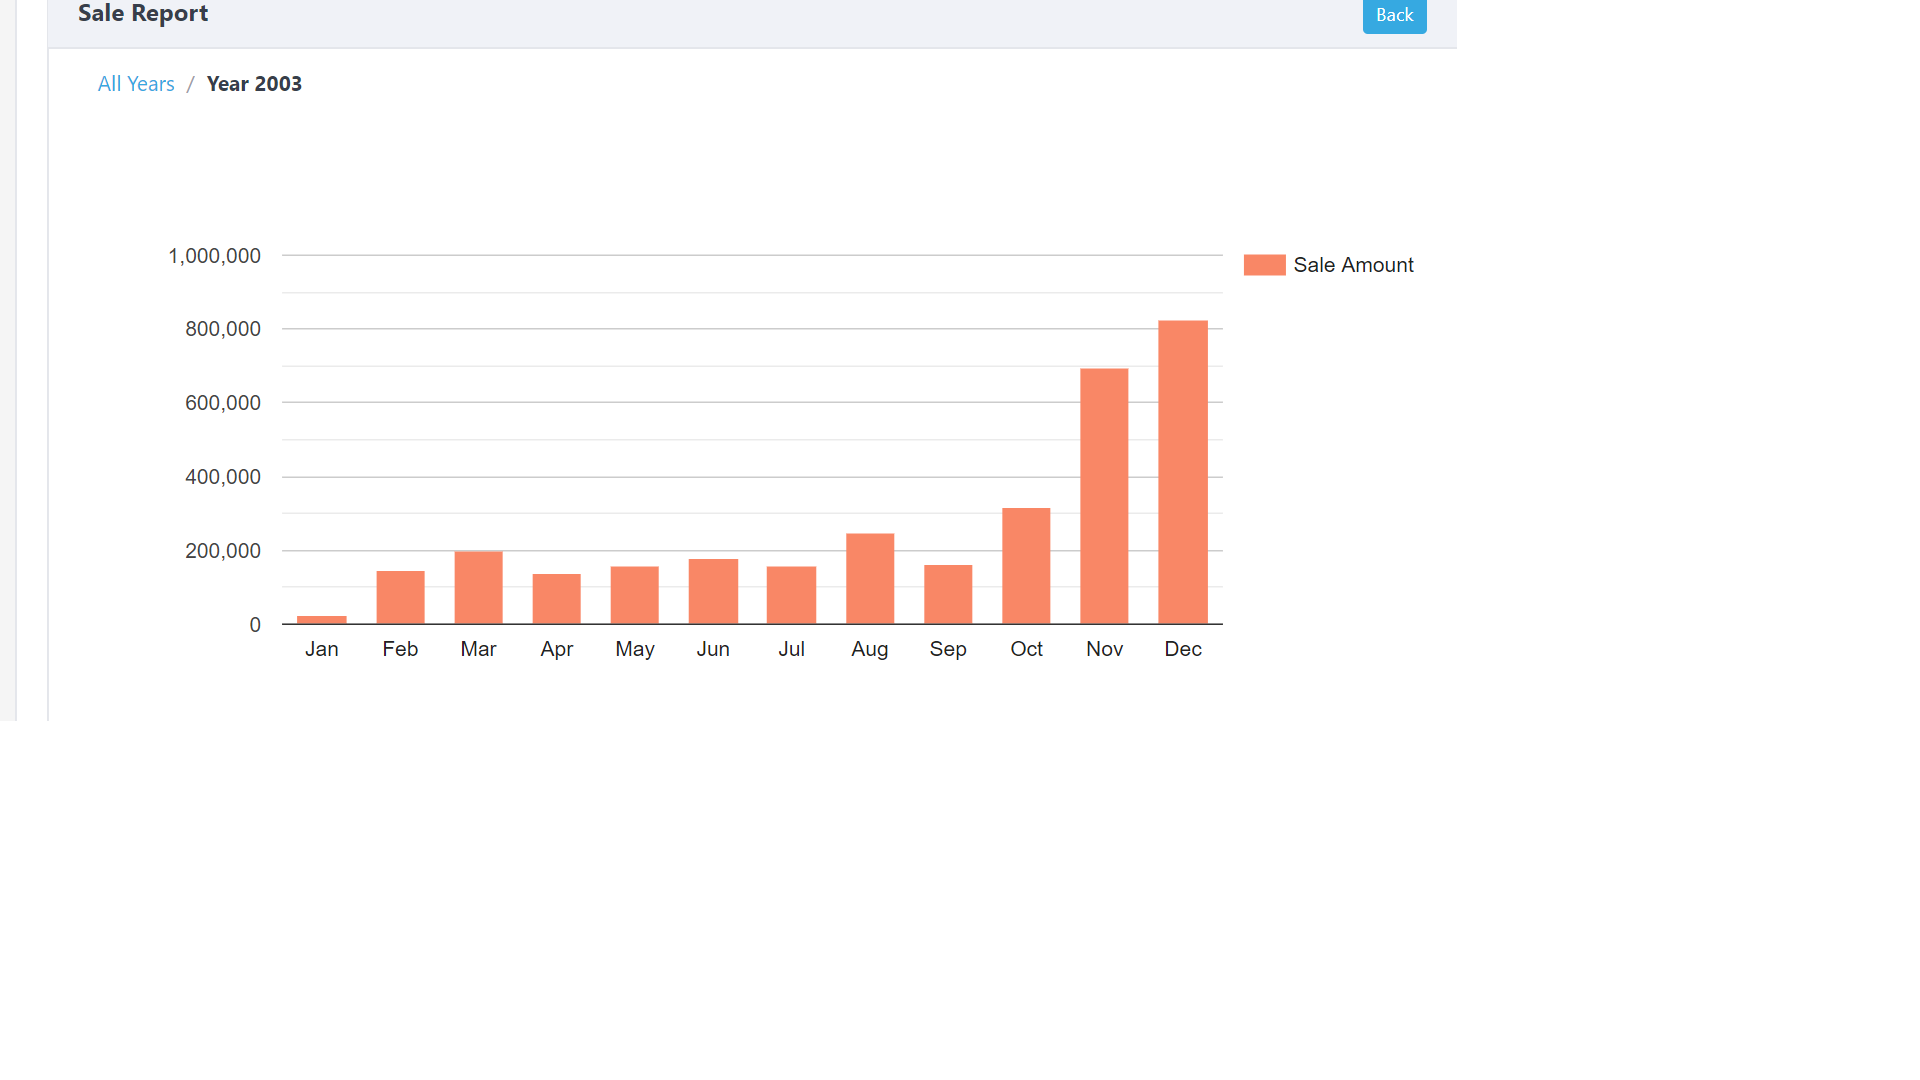
        "title"=>"Sale Report",
        "levels"=>array(
            array(
                "title"=>"All Years",
                "content"=>function($params,$scope)
                {
                    \koolreport\chartjs\ColumnChart::create(array(
                        "dataSource"=>$year_sale,
                        "columns"=>array(
                            "year",
                            "First Time User"=>array(
                                "label"=>"New",
                                "type"=>"number",
                                "config"=>array(
                                    "type"=>"bar",//Line chart is draw
                                )
                               
                            ),
                            "Repeat User"=>array(
                                "label"=>"Extended",
                                "type"=>"number",
                                "config"=>array(
                                    "type"=>"bar",//Line chart is draw
                                    
                                )
                                
                            ),
                         
                        ),
                        "options"=>array(
                            "tooltips"=>array(
                                "mode"=>"index",
                                "intersect"=>true,
                               
                            ),
                            "responsive"=>true,
                            "maintainAspectRatio"=>false,
                        ),
                        "clientEvents"=>array(
                            "itemSelect"=>"function(params){
                                saleDrillDown.next({year:params.selectedRow[0]});
                            }",
                        )
                    ));
                }
            ),
            array(
                "title"=>function($params,$scope)
                {
                    return "abcd";
                },
                "content"=>function($params,$scope)
                {
                    \koolreport\chartjs\ColumnChart::create(array(
                        "title"=>"month",
                        "dataSource"=>$time_sale,
                        "height"=>350,
                        "columns"=>array(
                            "month",
                            "First Time User"=>array(
                                "label"=>"New",
                                "type"=>"number",
                                "config"=>array(
                                    "type"=>"bar",//Line chart is draw
                                )
                               
                            ),
                            "Repeat User"=>array(
                                "label"=>"Extended",
                                "type"=>"number",
                                "config"=>array(
                                    "type"=>"bar",//Line chart is draw
                                    
                                )
                                
                            ),
                         
                        ),
                        "stacked"=>true,
                        "responsive"=>true,
                        "maintainAspectRatio"=>false,
                        "options"=>array(
                            "tooltips"=>array(
                                "mode"=>"index",
                                "intersect"=>true,
                               
                            ),
                            "responsive"=>true,
                            "maintainAspectRatio"=>false,
                        )
                    ));
                }                
            )
        ),
    ));

however i get this error :
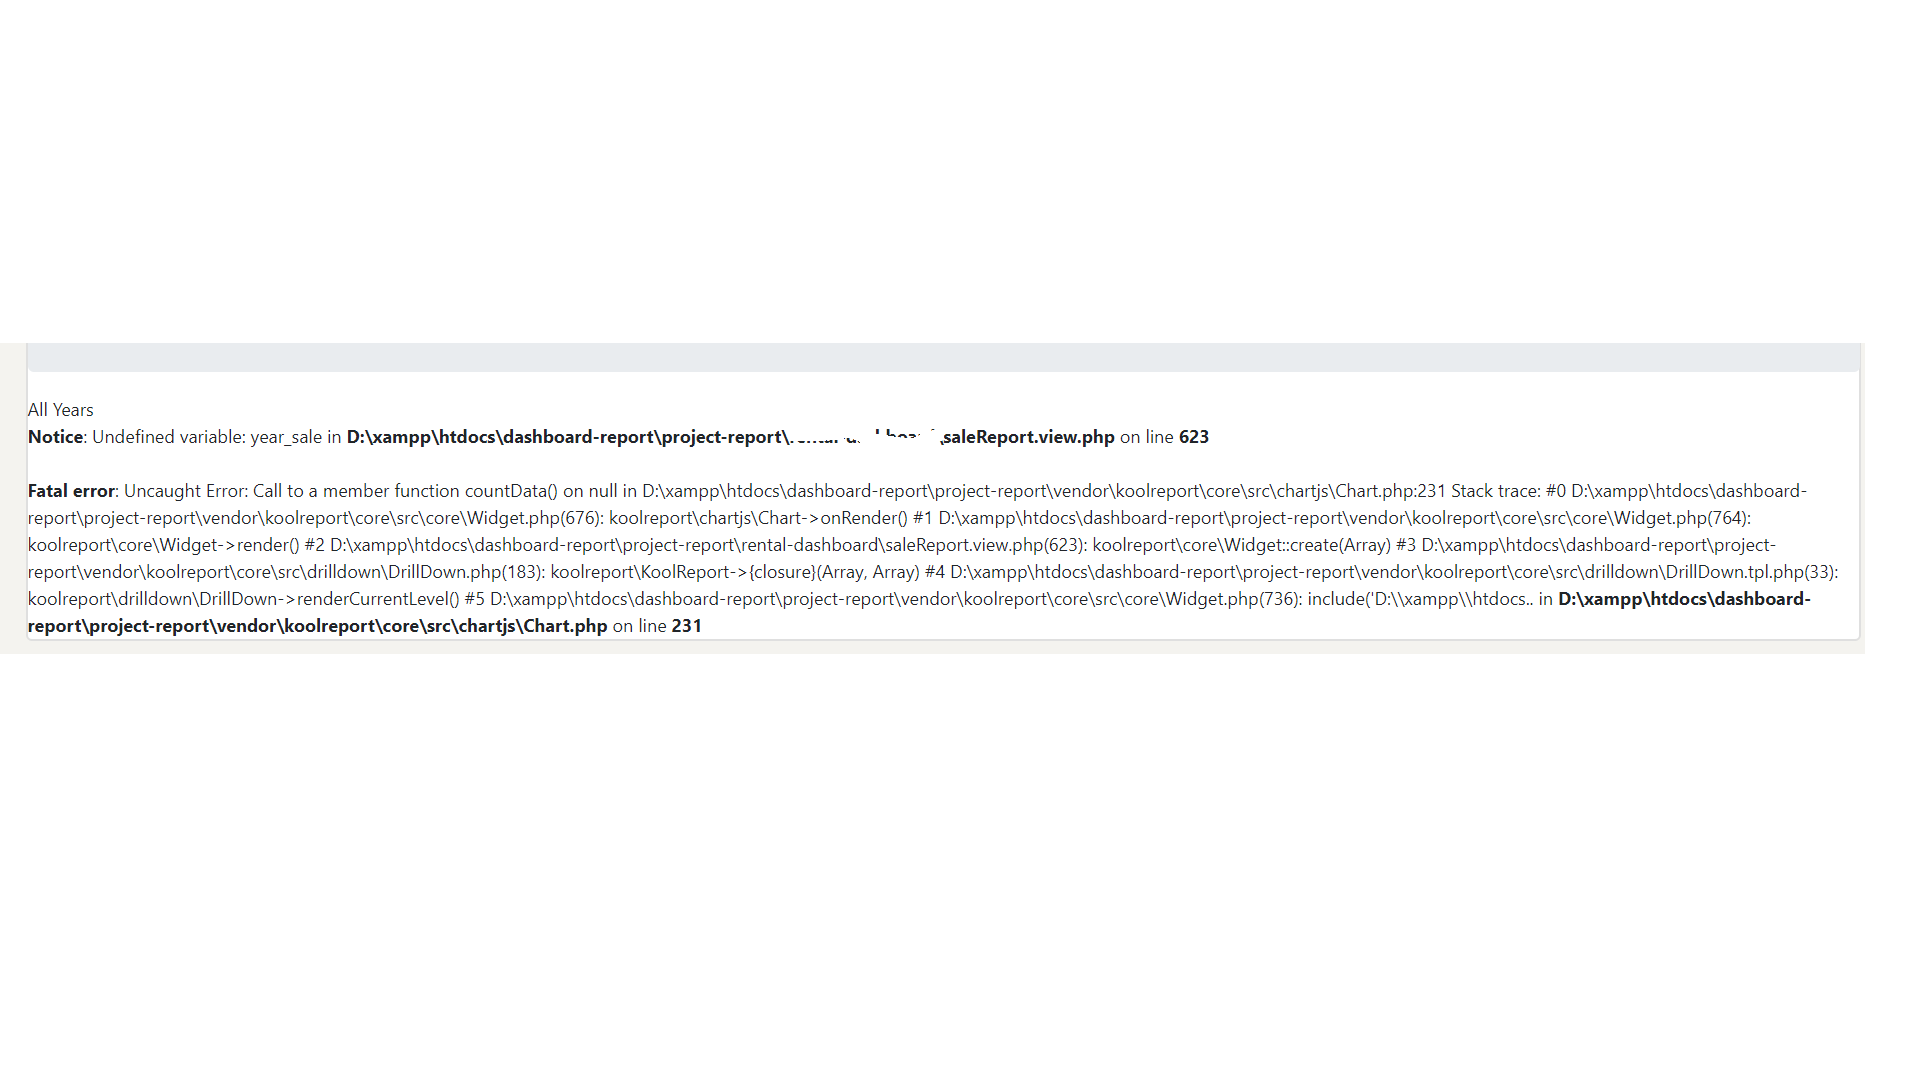
what should i do?

Alex Chartier commented on Jun 19, 2020

Where is $year_sale declared?

ankit raj commented on Jun 21, 2020

At the main level. I even tried declaring it in the same function where this widget is called,but it doesn't work, but if i declare a bar chart or other graphs solo instead it works. I cant understand the second warning too. hence i asked if we could pass an array of arrays: this is my variable: $year_sale = array(

array("year"=>2020,"label"=>"This year","First Time User"=>21300,"Repeat User"=>4000,"Repeat Users"=>500),
array("year"=>2019,"label"=>"Last year","First Time User"=>28300,"Repeat User"=>5000,"Repeat Users"=>1500),

);

Build Your Excellent Data Report

Let KoolReport help you to make great reports. It's free & open-source released under MIT license.

Download KoolReport View demo
None yet

DrillDown