KoolReport's Forum

Official Support Area, Q&As, Discussions, Suggestions and Bug reports.
Forum's Guidelines

Chart JS column chart compared to last year 2 seperate stacked bars for each month #1493

Open ankit raj opened this topic on on Jun 19, 2020 - 2 comments

ankit raj commented on Jun 19, 2020

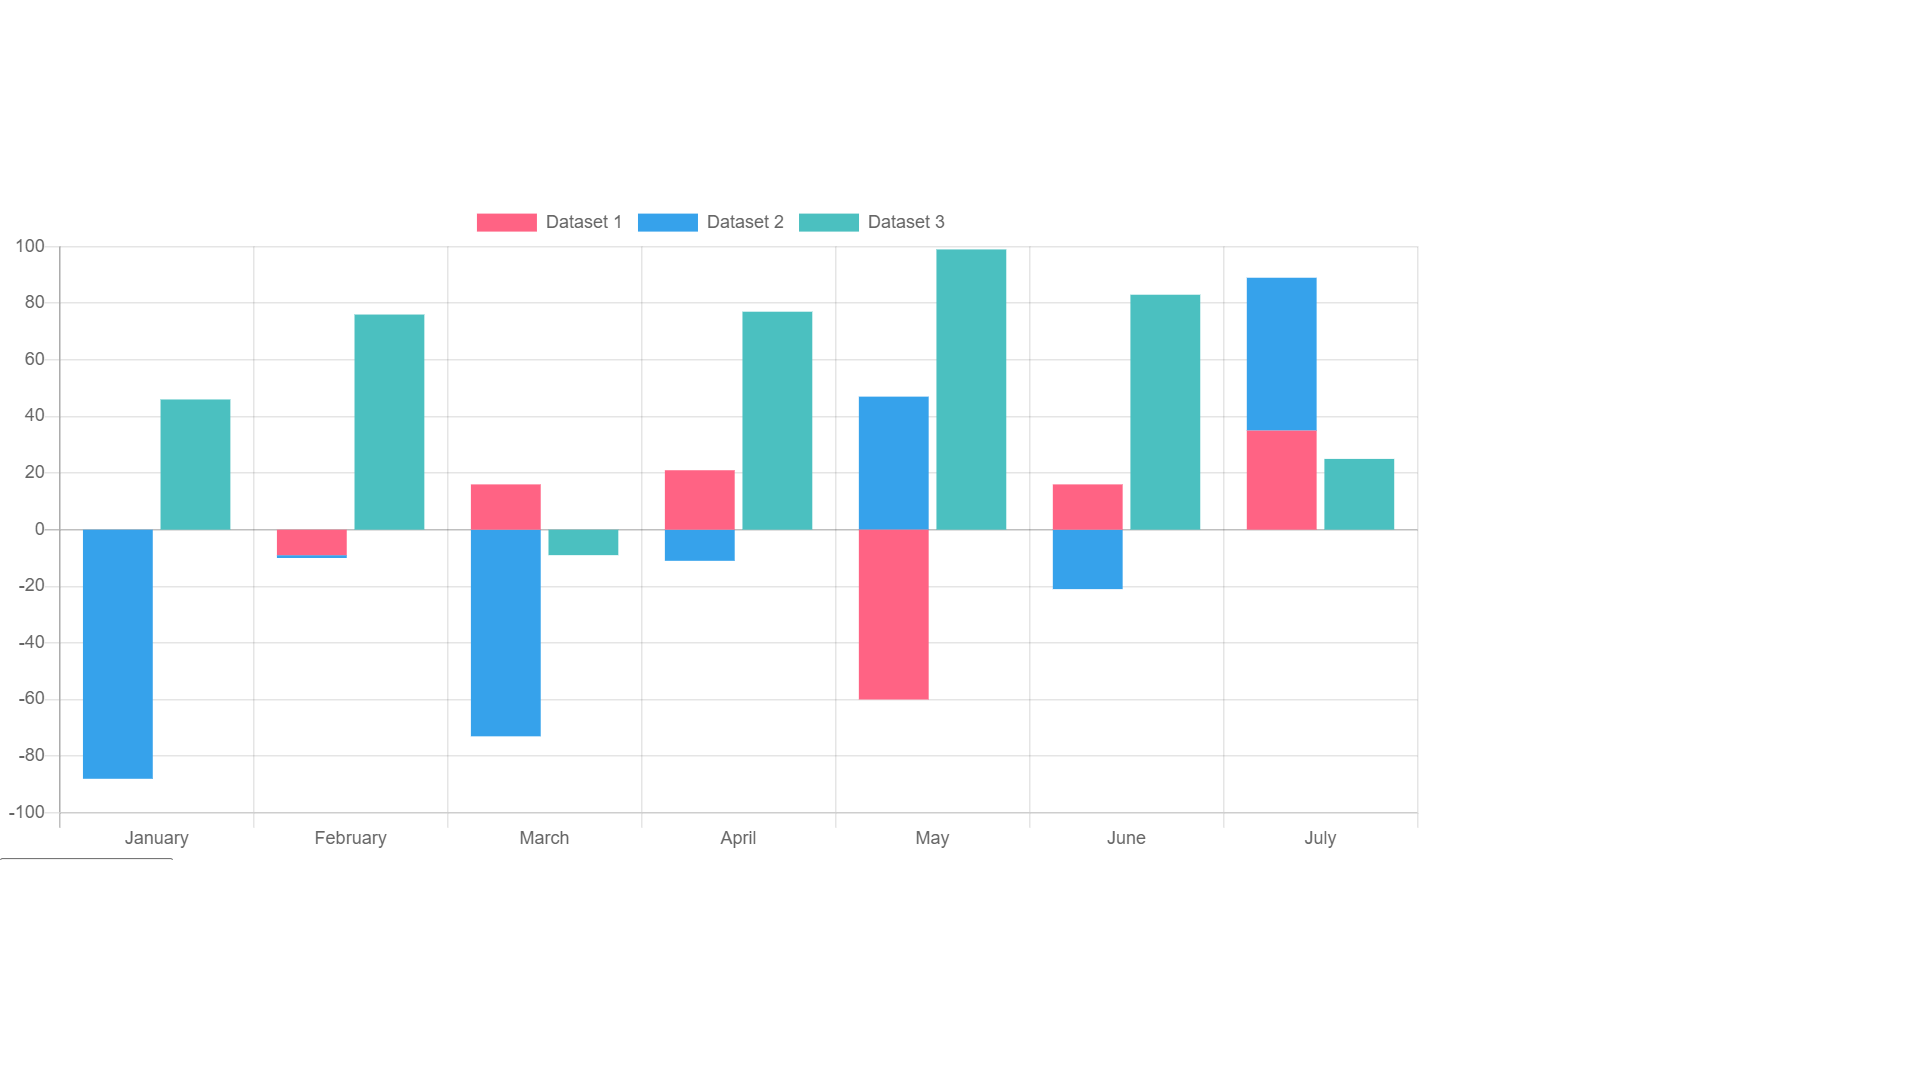
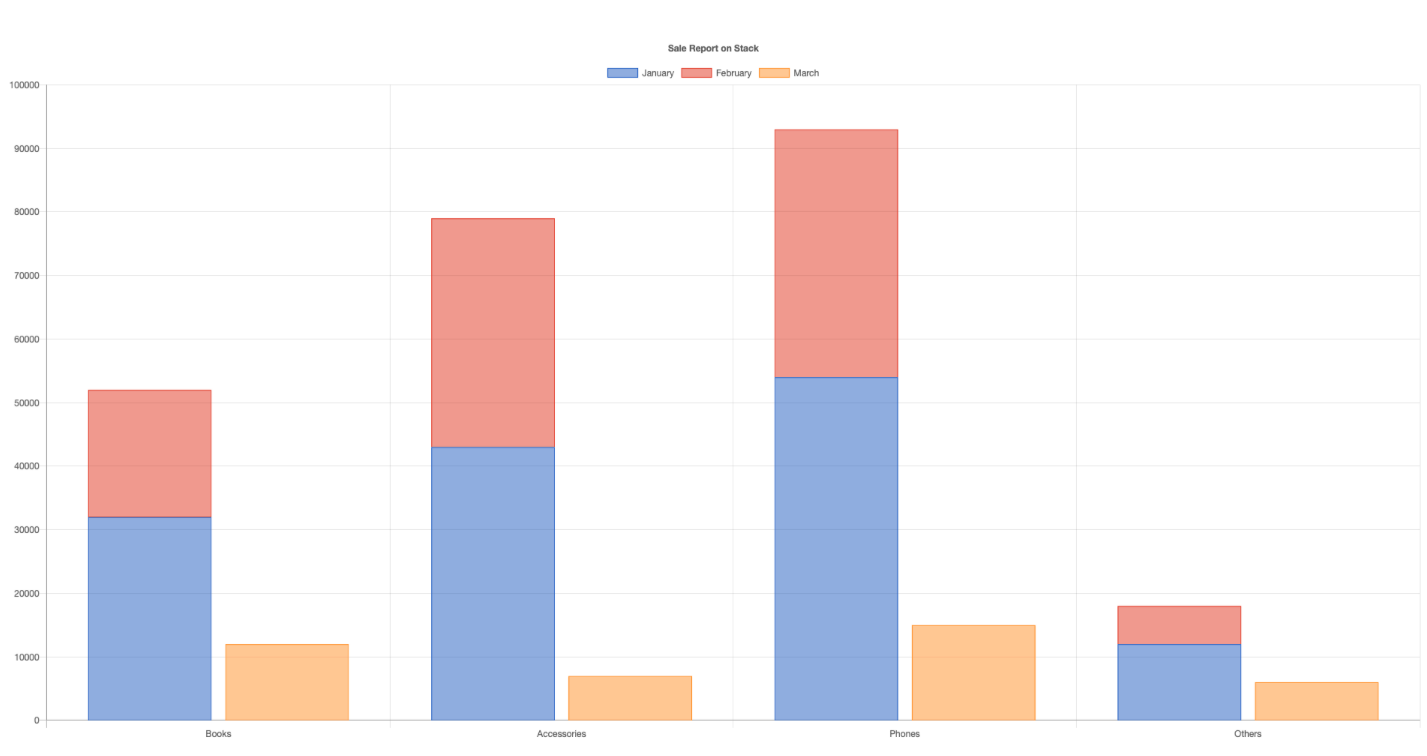
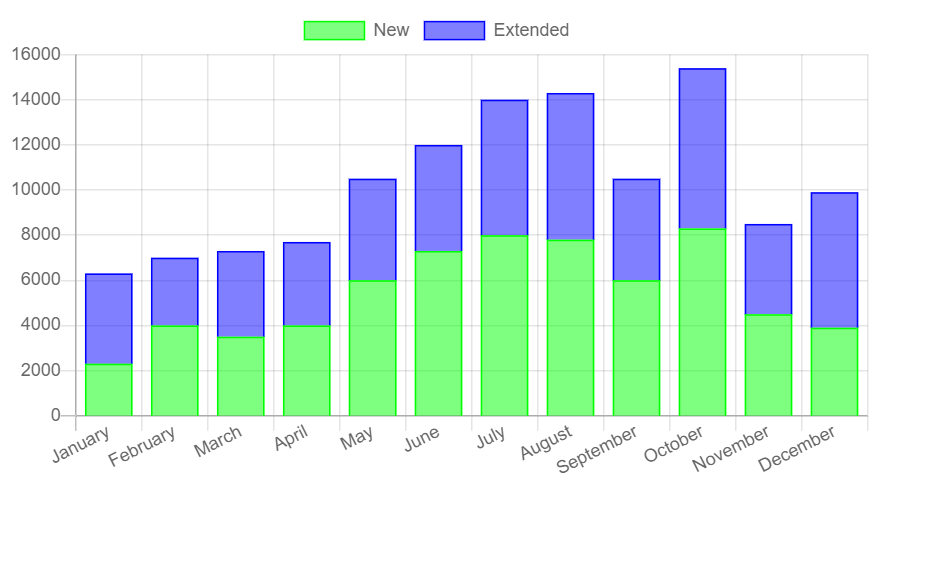
Hello as you can see in the picture i have a monthly stacked column chart which shows two products performance every month. i want a comparative stacked chart so that people can see the same 2 products last year of the same month. like in January we have one bar , i want 2 bars one for this year and one for last year and both should have 2 values.How do i pass data and achieve it? I basically want a group stacked bar chart This is my code.

$time_sale = array(
    array("month"=>"January","First Time User"=>2300,"Repeat User"=>4000,"Repeat Users"=>500),
    array("month"=>"February","First Time User"=>4000,"Repeat User"=>3000,"Repeat Users"=>1400),
    array("month"=>"March","First Time User"=>3500,"Repeat User"=>3800,"Repeat Users"=>800),
    array("month"=>"April","First Time User"=>4000,"Repeat User"=>3700,"Repeat Users"=>1300),
    array("month"=>"May","First Time User"=>6000,"Repeat User"=>4500,"Repeat Users"=>1400),
    array("month"=>"June","First Time User"=>7300,"Repeat User"=>4700,"Repeat Users"=>400),
    array("month"=>"July","First Time User"=>8000,"Repeat User"=>6000,"Repeat Users"=>230),
    array("month"=>"August","First Time User"=>7800,"Repeat User"=>6500,"Repeat Users"=>800),
    array("month"=>"September","First Time User"=>6000,"Repeat User"=>4500,"Repeat Users"=>200),
    array("month"=>"October","First Time User"=>8300,"Repeat User"=>7100,"Repeat Users"=>300),
    array("month"=>"November","First Time User"=>4500,"Repeat User"=>4000,"Repeat Users"=>1500),
    array("month"=>"December","First Time User"=>3900,"Repeat User"=>6000,"Repeat Users"=>200),
);

       \koolreport\chartjs\ColumnChart::create(array(
                                    "title"=>"Rental Activation Month Wise Report",
                                    "dataSource"=>$time_sale,
                                    "height"=>350,
                                    "columns"=>array(
                                        "month",
                                        "First Time User"=>array(
                                            "label"=>"New",
                                            "type"=>"number",
                                            "config"=>array(
                                                "type"=>"bar",//Line chart is draw
                                            )
                                           
                                        ),
                                        "Repeat User"=>array(
                                            "label"=>"Extended",
                                            "type"=>"number",
                                            "config"=>array(
                                                "type"=>"bar",//Line chart is draw
                                                
                                            )
                                            
                                        ),
                                     
                                    ),
                                    "stacked"=>true,
                                    "responsive"=>true,
                                    "maintainAspectRatio"=>false,
                                    "options"=>array(
                                        "tooltips"=>array(
                                            "mode"=>"index",
                                            "intersect"=>true,
                                           
                                        ),
                                        "responsive"=>true,
                                        "maintainAspectRatio"=>false,
                                    )
                                ));

This is what i have:

and this is what i want:

ankit raj commented on Jun 22, 2020

Hi @koolreports, can you please help

Venom commented on Jan 8, 2021

I managed to build the Chartjs stacked bar by group , but you need to modify an existing file

Open BarChart.php and go to line 57 then add

 if(array_key_exists('stack',$cSettings)){   //Check if stack property is set
                $dataset['stack']=$cSettings['stack'];
            }

<?php

namespace koolreport\chartjs;
use \koolreport\core\Utility;

class BarChart extends Chart
{
    protected $type="horizontalBar";
    protected $stacked = false;

    protected function onInit()
    {
        parent::onInit();
        $this->stacked = Utility::get($this->params,"stacked",false);
    }

    protected function processOptions()
    {
        $options = $this->options;

        if($this->stacked)
        {
            $options["scales"] = Utility::get($options,"scales",array());
            $options["scales"]["yAxes"] = Utility::get($options["scales"],"yAxes",array(array()));
            foreach($options["scales"]["yAxes"] as &$axis)
            {
                $axis["stacked"] = true;
            }
            $options["scales"]["xAxes"] = Utility::get($options["scales"],"xAxes",array(array()));
            foreach($options["scales"]["xAxes"] as &$axis)
            {
                $axis["stacked"] = true;
            }
        }
        return $options;
    }

    protected function processData()
    {
        
        $columns = $this->getColumns();
        $columnKeys = array_keys($columns);
        
        $labels = array();
        $datasets = array();
        for($i=1;$i<count($columnKeys);$i++)
        {
            $cSettings = Utility::get($columns,$columnKeys[$i]);
            $dataset = array(
                "label"=> Utility::get($cSettings,"label",$columnKeys[$i]),
                "borderWidth"=>1,
                "borderColor"=>$this->getColor($i-1),
                "backgroundColor"=>$this->getRgba($this->getColor($i-1),$this->backgroundOpacity),
                "data"=>array(),
                "fdata"=>array(),
            );
            if(array_key_exists('stack',$cSettings)){   //Check if stack property is set
                $dataset['stack']=$cSettings['stack'];
            }
            $config = Utility::get($cSettings,"config");
            if($config!==null)
            {
                $dataset = array_merge($dataset,$config);
            }
            array_push($datasets,$dataset);
        }

        $this->dataStore->popStart();
        while($row = $this->dataStore->pop())
        {
            array_push($labels,$row[$columnKeys[0]]);
            for($i=1;$i<count($columnKeys);$i++)
            {
                array_push($datasets[$i-1]["data"],$row[$columnKeys[$i]]);
                array_push($datasets[$i-1]["fdata"],$this->formatValue($row[$columnKeys[$i]],$columns[$columnKeys[$i]],$row));   
            }
        }
        $data = array();
        $data["labels"] = $labels;
        $data["datasets"] = $datasets;
        return $data;
    }
}

When you create the ColumnChart, add the stack setting like below to define the stack group.

"stack"=> 'Stack 0'

<div style="margin-bottom:50px;">
<?php
ColumnChart::create(array(
    "title"=>"Sale Report on Stack",
    "dataSource"=>$category_sale_month,
    "columns"=>array(
        "category",
        "January"=>array("label"=>"January","type"=>"number","prefix"=>"$","stack"=> 'Stack 0'),
        "February"=>array("label"=>"February","type"=>"number","prefix"=>"$","stack"=> 'Stack 0'),
        "March"=>array("label"=>"March","type"=>"number","prefix"=>"$","stack"=> 'Stack1'),
    ),
    "stacked"=>true
));
?>
</div>

Stacked bar by group

Build Your Excellent Data Report

Let KoolReport help you to make great reports. It's free & open-source released under MIT license.

Download KoolReport View demo
help needed

ChartJS