Hey guys,
This is my first time using KoolReport and I would like to use it for multiple projects within my company.
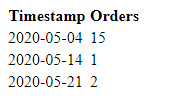
I have configured a basic line chart which displays number of sales for a particular flavour, for this month, grouped by days.


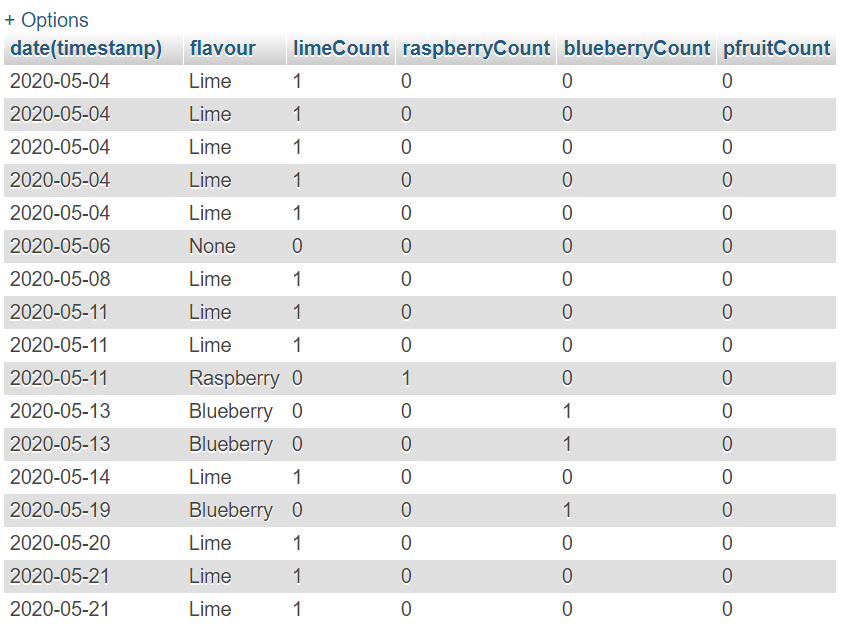
As far as I can tell, it works fairly well. However, now I would like to add another line for another flavour. The SQL statement below grabs the flavour 'Cola', so is it possible to add another SQL query that grabs 'Lemon' and adds that as another Y-axis on the chart?
SELECT date(timestamp),count(id) FROM dbTable WHERE MONTH(timestamp) = MONTH(CURRENT_DATE()) AND YEAR(timestamp) = YEAR(CURRENT_DATE()) AND location = 'UK' AND flavour = 'Cola' GROUP BY timestamp;
. SalesByCustomer.php . SalesByCustomer.view.php *. index.php
I have linked all of the PHP files above - sorry I couldn't use proper forum code blocks, as the PHP code isn't compatible with the forum encoder.
Any help would be appreciated!
Thanks, Ryan.
