KoolReport's Forum

Official Support Area, Q&As, Discussions, Suggestions and Bug reports.
Forum's Guidelines

Pivot Report is not generating as expected #1267

Closed prana_chak opened this topic on on Jan 22, 2020 - 10 comments

prana_chak commented on Jan 22, 2020

Hi Team, I am not able to generate one pivot report with the KoolReport Pivot package inside our laravel 5.8 application. I have attached the image of the report (wrong view) from my code output. Please find below my code in 2 different files. as Report.php and Report.view.php.

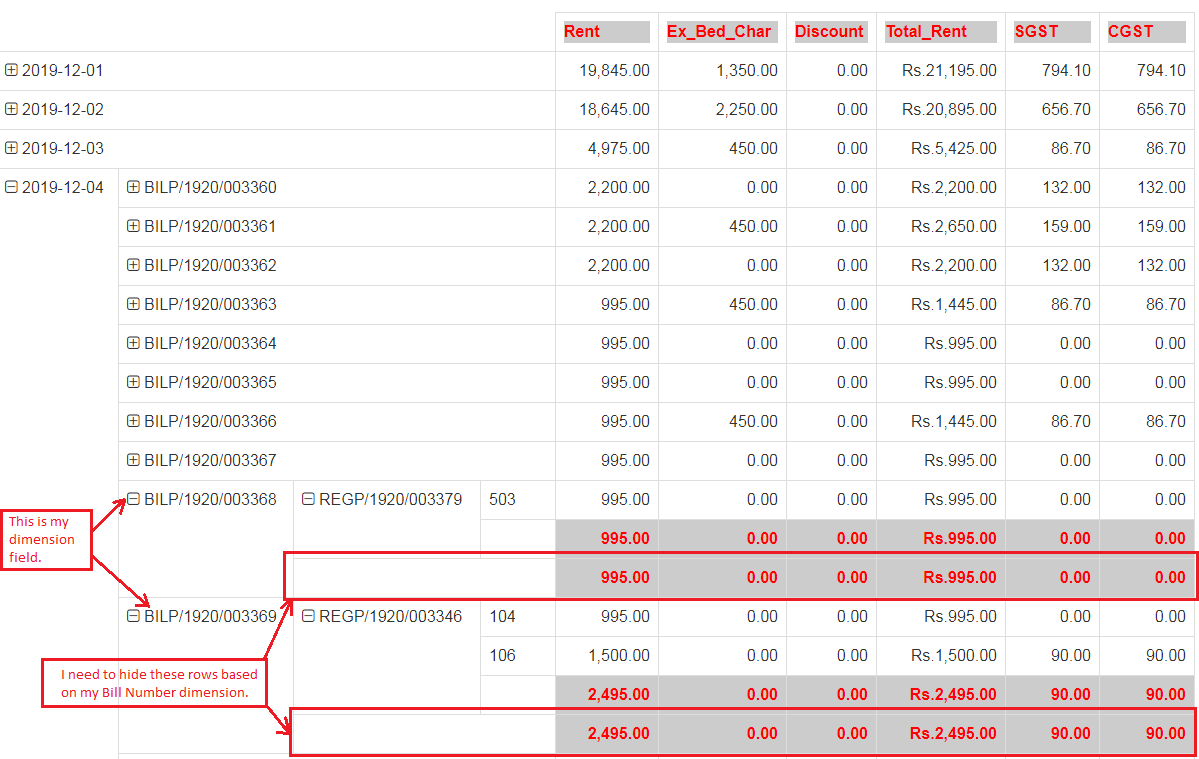
![Report Output from current code]: (https://cdn.koolreport.com/assets/images/editor/c4/image5e27e4c921056.png)

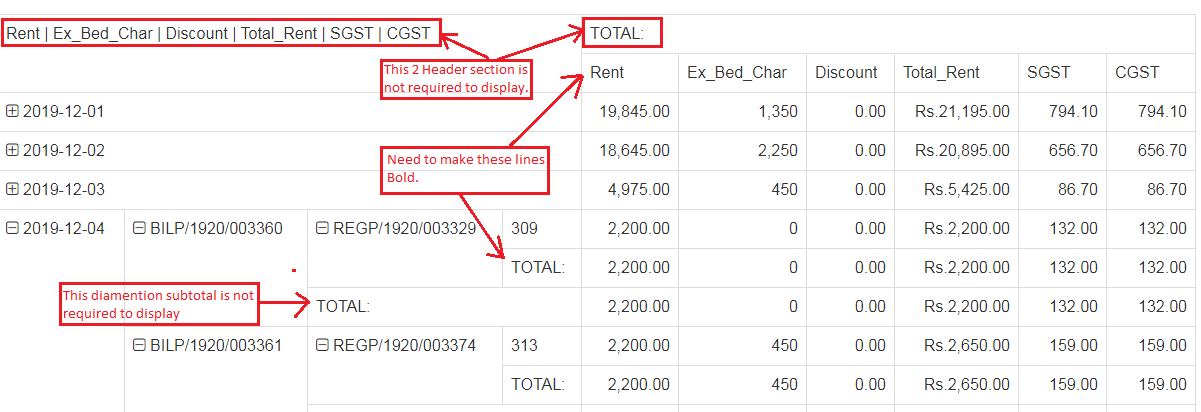
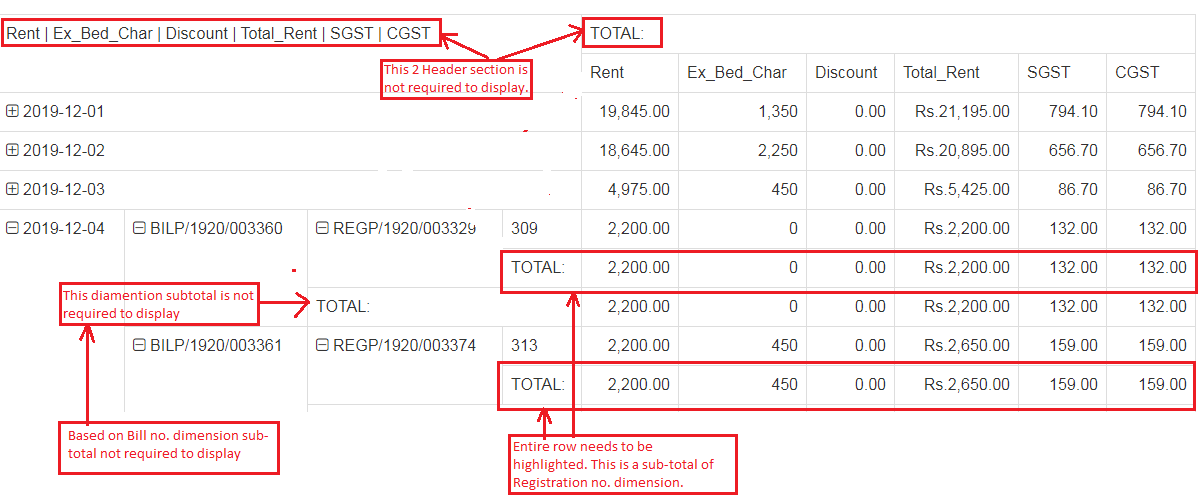
![Expected Report Format]: (https://cdn.koolreport.com/assets/images/editor/c4/image5e27eae8437fd.png)

*Please suggest in urgent to get my desired output.

<Report.php> file

function setup()
    {        
        \DB::connection(\Session::get('dynamic_db_name'))->enableQueryLog();
       
        $this->src(\Session::get('dynamic_db_name'))        
        ->query("Select DISTINCT fbill.Intno, fbill.Billno, fbill.Billdt, fd.Roomno, fd.Rate 
            , rg.Regno, rg.Companynm, rg.Compgst, rcpt.Modeofpay
            From fbilldtl as fd
            Left join fbill on fd.FBintno = fbill.Intno
            Left join registration as rg on fd.Regintno = rg.Intno 
            Left join rcpt on rcpt.Regintno = rg.Intno
            where fbill.Billdt between '2019-12-01' and '2019-12-15'")
            
            ->pipe(new ColumnMeta(array(
                'Rate'=>array(
                    'label' => 'Rent,',
                    'type' => 'number',
                    'prefix' => 'Rs.',
                    'decimals'=>2
                ),
                'Billdt' => array(
                    'label' => 'Bill Date',
                    'type' => 'date'                    
                ),
                'Billno' => array(
                    'label' => 'Bill No.',
                    'type' => 'string'
                ),
                'Regno' => array(
                    'label' => 'Reg. No.',
                    'type' => 'string'
                ),
                'Companynm' => array(
                    'label' => 'Company/Ageent',
                    'type' => 'string'
                ),
                'Compgst' => array(
                    'label' => 'Company GST No.',
                    'type' => 'string'
                ),
                'Modeofpay' => array(
                    'label'=> 'Mode of Pay',
                    'type' => 'string'
                ),
                'Roomno' => array(
                    'label' => 'Room No.',
                    'type' => 'string'
                )
            )))
            ->pipe(new Pivot(array(
                'dimensions'=>array(
                    'row'=>'Billdt, Billno, Regno, Companynm, Compgst, Modeofpay, Roomno'
                ),
                'aggregates'=>array(
                    'sum'=>'Rate'
                )
            )))
        ->pipe($this->dataStore("bills"));        
    } 
<Report.view.php> file

<?php
use \koolreport\widgets\koolphp\Table;
use \koolreport\widgets\google\ColumnChart;
use \koolreport\widgets\google\AreaChart;
use \koolreport\widgets\google\ComboChart;
use \koolreport\widgets\google\PieChart;
use \koolreport\pivot\widgets\PivotTable;
?>
<html>
    <head>
    <title>Menu Report</title>
    </head>
    <body>        
        <link rel="stylesheet" href="../../../assets/bs3/bootstrap.min.css" />
        <link rel="stylesheet" href="../../../assets/bs3/bootstrap-theme.min.css" /> 
        <link rel="shortcut icon" href="/examples/assets/images/bar.png">
        <link href="/examples/assets/fontawesome/font-awesome.min.css" rel="stylesheet">
        <link href="/examples/assets/simpleline/simple-line-icons.min.css" rel="stylesheet">
        <link href="/examples/assets/theme/theme.min.css" rel="stylesheet">
        <link href="/examples/assets/theme/tomorrow.css" rel="stylesheet">
        <link href="/examples/assets/theme/app.css" rel="stylesheet">

        <script type="text/javascript" src="/examples/assets/theme/jquery.min.js"></script>
        <script type="text/javascript" src="/examples/assets/theme/bootstrap.bundle.min.js"></script>
        <script type="text/javascript" src="/examples/assets/theme/app.js"></script>
        <script src="//cdnjs.cloudflare.com/ajax/libs/highlight.js/9.9.0/highlight.min.js"></script> 
        <script type='text/javascript' src='/koolreport/core/src/clients/core/KoolReport.js'></script>
		
        <div id="reportbody">           
            <div class='row'>
                <div class="col-md-6">
                    <h3 class="text-center">Hotel Bill Report</h2>   
                    <?php
                    //echo '<pre>';
                    //print_r($this->dataStore("bills"));die();
                        $dataStore = $this->dataStore('bills');
                        PivotTable::create(array(
                          "dataStore"=>$dataStore,
                          "rowDimension"=>"row",
                          "columnDimension"=>"column",
                          "measures"=>array(
                            'Rate', 
                            // 'dollar_sales - count',
                          ),                          
                          'rowSort' => array(
                            'Billdt' => 'asc',
                          ),                          
                          'rowCollapseLevels' => array(0),
                          'columnCollapseLevels' => array(0),
                          'width' => '100%',
                          'nameMap' => array(
                            'Rate - sum' => 'Rent (in INR)'                            
                          ),
                        ));
                    ?>                   
                   
                </div>                
            </div>
        </div>
    </body>
</html>
prana_chak commented on Jan 22, 2020

That issue got resolved after properly defining the .css & .js file path within the view page.

Still, I have the concern with the view as I am looking for. What is the solution to display the measures's heading (like Rate, discount etc.), instead of showing 'Total' as the column heading?? (Please confirm, if that option is there in your tool). Otherwise, the report will not be understandable for the end user. Column heading change option is important to build.

David Winterburn commented on Jan 23, 2020

Hi,

If you want to show measure header, please try this option which works for both PivotTable and PivotMatrix:

https://www.koolreport.com/docs/pivot/pivottable_and_pivotmatrix/#properties-show-data-field-headers-(version-%3E=-5.0.0)

Let us know if you have any question. Thank!

prana_chak commented on Jan 24, 2020

Hi Devid, Thanks! for your last comment. I need little bit more customization in my report as the screen shot below.

  1. Hide First "Total" row header and list of list of measures name on top of dimension heading (if I can replace with the dimension column heading).
  2. Need to hide the Total row of some dimension. Though I have to display that particular the dimension (not the total).
  3. Need to make subtotal row and header name in Bold and with some color theme.

David Winterburn commented on Jan 30, 2020

Just add some CSS rules to your page:

  <style>
    .pivot-data-field-content,
    .pivot-row-header-total .pivot-row-header-text,
    .pivot-column-header-total .pivot-column-header-text,
    .pivot-row-header-grand-total .pivot-row-header-text,
    .pivot-column-header-grand-total .pivot-column-header-text {
      visibility: hidden;
    }

    .pivot-data-header-text {
      font-weight: bold;
    }
  </style>
prana_chak commented on Jan 30, 2020

@David, My requirement was little bit different as below, i. Bold: Entire Sub/Grand total row including measure values needs to highlight as bold, which are not hidden. ii. Hide Row: Entire Sub Total row including measure values (sum) needs to be hidden based on my requirement for a particular dimension. Or, Hide Row: Can we make group under some dimension field and mention some list of fields under the main dimension.So, the Sub/Grand total will happen on main dimensions and I will be able to display the sub- dimensions not sum for that. iii. Hide the header on top of dimension, where it is displaying the list of measure name.

David Winterburn commented on Jan 30, 2020

It's quite complicated. I think it's better if you add a screenshot with explanation for hiding/bolding certain sections.

Please also inspect the PivotTable elements. Our PivotTable has a lot of CSS classes and attributes which could help you to identify particular sections and apply specific CSS rules to them.

prana_chak commented on Jan 30, 2020

@David, I am re-sending the screenshot here. I have tried to explain the requirement written in red color. So, the basic understanding is that, I should have the option to hide (sub/group total) of some particular dimension and should have option to highlight the sub/group total of other dimensions, which will not be marked as hidden.

prana_chak commented on Jan 30, 2020

Hi David,

Based on your input I have almost done all kind of customization except one i.e. hiding sub/group total row with respect to a particular dimension. Follow my current code <style>, which may help others. Below I am attaching new screenshot with my requirement.

<style>
            .pivot-data-field-content,
            .pivot-data-field-zone,
            .pivot-row-header-total .pivot-row-header-text,            
            .pivot-column-header-total .pivot-column-header-text, 
            .pivot-column-header-grand-total{
                visibility: hidden;
            }

            .pivot-data-header-text, .pivot-data-cell-row-total, 
            .pivot-row-header-grand-total, .pivot-data-cell-row-grand-total {
                font-weight: bold;
                color: #ff0000;
                background-color: #ccc;
            }
        </style>
David Winterburn commented on Jan 31, 2020

Hi,

Please try this CSS rule:

<style>
    .pivot-row-header-total[data-row-field="1"],
    .pivot-data-cell-row-total[data-row-field="1"]  {
      display: none;
    }
</style>

Change the data-row-field value if you want. Let us know how it works. Thanks!

prana_chak commented on Jan 31, 2020

Thanks! David, It is working now.

Build Your Excellent Data Report

Let KoolReport help you to make great reports. It's free & open-source released under MIT license.

Download KoolReport View demo
help needed
solved

Pivot