KoolReport's Forum

Official Support Area, Q&As, Discussions, Suggestions and Bug reports.
Forum's Guidelines

LineChart Customization #1213

Open Brindicis opened this topic on on Dec 11, 2019 - 1 comments

Brindicis commented on Dec 11, 2019

Hey.

I'm having some trouble with the element "LineChart" from the package "Google Charts".

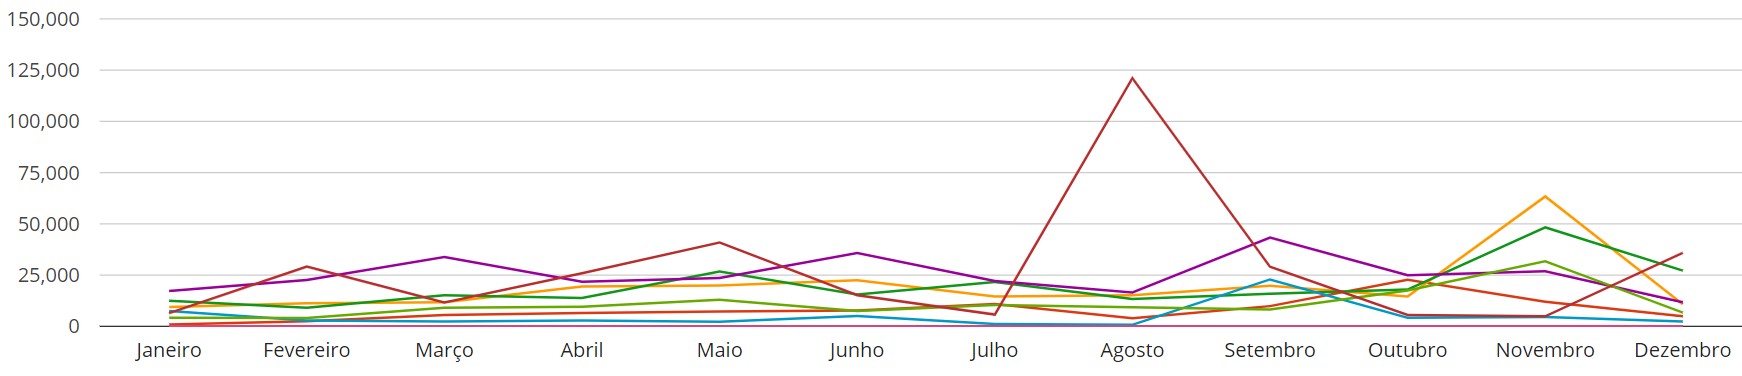
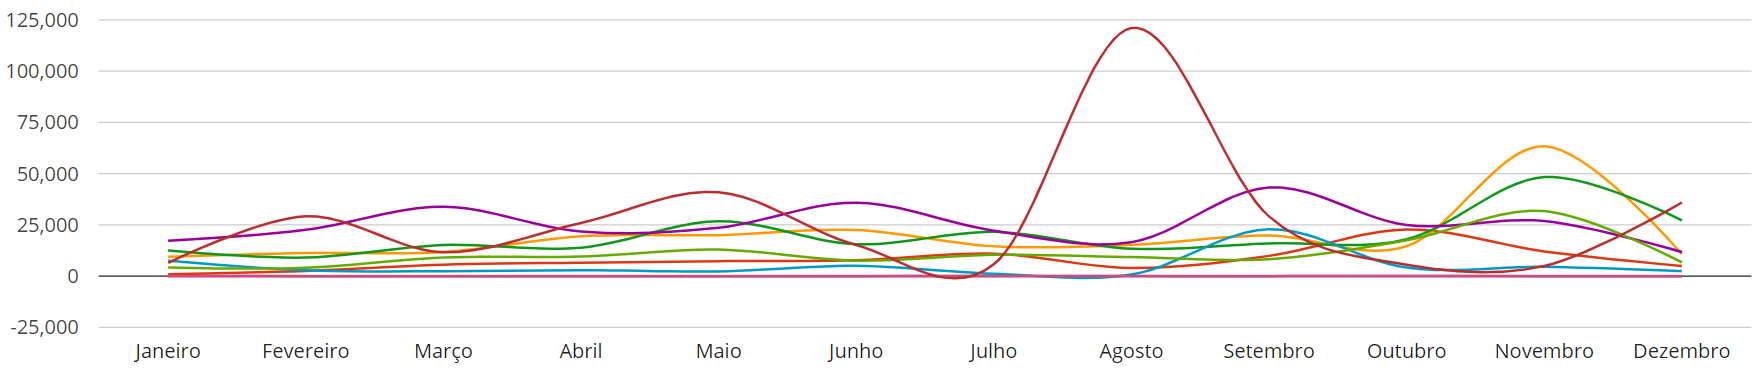
  1. When i change it's "curveType" to "function" it adds negative values to it's range even though there aren't any in the dataStore.
  2. Then i wanted to know if the Y range can be changed for bigger intervals.

In the pictures below you can see what is hapening in the first topic.

KoolReport commented on Dec 11, 2019

Please try:

LineChart::create([
    ...
    "options"=>array(
        "vAxis"=>[
            "ticks"=>[0,50000,100000,150000,20000]
        ]
    )
])

Build Your Excellent Data Report

Let KoolReport help you to make great reports. It's free & open-source released under MIT license.

Download KoolReport View demo
help needed

None