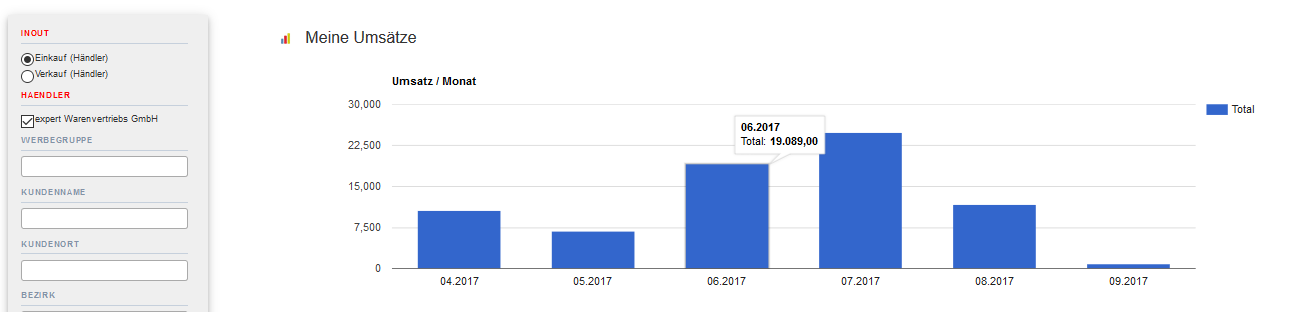
Hmm, strange. As soon as I add the "columns"=>array(...) I get the following error message instead of the chart in frontend:
"Not enough columns given to draw the requested chart!"
Here is my view:
<?php
google\ColumnChart::create(array(
"dataStore"=>$this->dataStore('AutoRepGoogleChartUmsatz'),
"columns"=>array(
"Umsatz"=>array(
"label"=>"Umsatz",
"type"=>"number",
"prefix"=>"",
"annotation"=>function($row)
{
return "$".number_format($row["Umsatz"]);
},
)
),
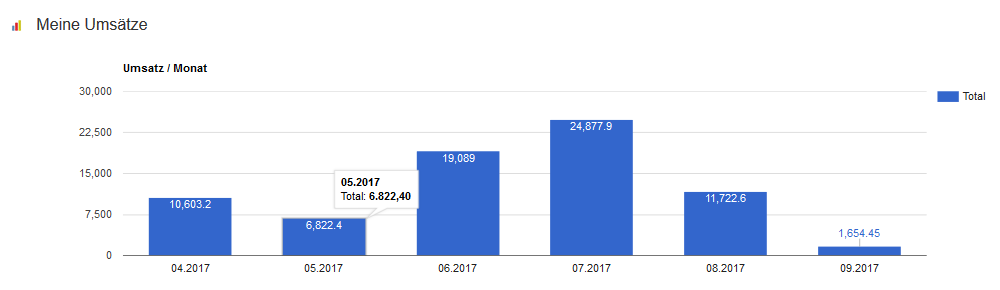
"options"=>array(
"title"=>"Umsatz / Monat",
"isStacked"=>true,
"orientation"=>"horizontal", //vertical
),
"width"=>"100%",
));
?>
And here my setup:
    $this->src('autorep')
	->query("
		SELECT
			WerbegruppeVerbund, Monat, Quartal, NikonKdName, NikonOrt, NikonProdGruppe, NikonArtBez, BestandHaendler_aktuell, BestandZentrale_aktuell, Umsatz, Verkaufsmenge
		FROM Reporting.autorep_v_noNulls
		WHERE
			Sell = (:Sell) AND
			KdName IN (:KdName) AND
			$whereWerbegruppe AND
			$whereNikonKdName AND
			$whereNikonOrt AND
			$whereADBezirk AND
			$whereNikonProdGruppe AND
			$whereNikonArtBez AND
			$whereQuartal AND
			$whereMonat

		")->params(array(
		":Sell"=>$this->params["Sell"],
		":KdName"=>$this->params["KdName"],
		":Werbegruppe"=>$this->params["Werbegruppe"],
		":NikonKdName"=>$this->params["NikonKdName"],
		":NikonOrt"=>$this->params["NikonOrt"],
		":ADBezirk"=>$this->params["ADBezirk"],
		":NikonProdGruppe"=>$this->params["NikonProdGruppe"],
		":NikonArtBez"=>$this->params["NikonArtBez"],
		":Quartal"=>$this->params["Quartal"],
		":Monat"=>$this->params["Monat"]
		))
	->pipe(new ColumnMeta(array(
        "Umsatz"=>array(
			"align"=>"right",
            "type"=>"number",
            "prefix"=>"",
			"suffix"=>"",
			"decimals"=>2,
			"thousandSeparator"=>".",
			"decimalPoint"=>",",
        )
	)))
    ->pipe(new Cube(array(
        "row"=>"Monat",
        "sum"=>"Umsatz",
    )))
	->pipe(new ColumnMeta(array(
		"{{all}}"=>array(
			"label"=>"Total",
		)
	)))
    ->pipe(new Sort(array(
        "Monat"=>"asc"
    )))

    ->pipe($this->dataStore('AutoRepGoogleChartUmsatz'));
Any idea what is wrong here?