KoolReport's Forum

Official Support Area, Q&As, Discussions, Suggestions and Bug reports.
Forum's Guidelines

ChartJS yAxes tick formatting issue #1151

Closed Jeno Haraszti opened this topic on on Nov 13, 2019 - 4 comments

Jeno Haraszti commented on Nov 13, 2019

Hello, Can you please provide me some idea, why my code does not add the $ sign to the yAxes ticks on the ChartJs Column chart?

ColumnChart::create(array(
	"dataStore"=>$this->dataStore("data"),
	"columns" => array(
	    "month",
		"amountSum"=>array(
			"label" => "Revenue",
			"type" => "number",
			"prefix" => "$ "
		)
    ),
    "options" => array(
        "scales"=>array(
        	"Axes"=>array(array(
            	"ticks"=>array(
            		"callback"=>function($value, $index, $values) { return "$ ".$value;}
            	)
            	)
            ))
        )
    )

);

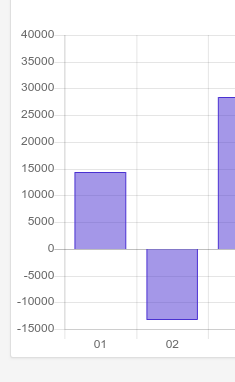
The chart still looks like this:

Thanks for your support in advance!

KoolReport commented on Nov 14, 2019

Hi Jeno,

The callback should be javascript function, Please try to do this:

...
    "callback"=>"function(value, index, values) {
        return '$ '+value;
    }",
...

Let me know if it works.

Jeno Haraszti commented on Nov 14, 2019

Unfortunately it did not help

KoolReport commented on Nov 15, 2019

I just found that you use "Axes", I think it should be "yAxes". Please try again and let me know.

Jeno Haraszti commented on Nov 15, 2019

You are great. Now it works perfectly. Many thanks!

Build Your Excellent Data Report

Let KoolReport help you to make great reports. It's free & open-source released under MIT license.

Download KoolReport View demo
help needed

ChartJS