Hi
I have a database table with dates from 2013 and I want a Column Graph that shows Monthly Events on year by year basis in other words x-axis shows Jan - Dec and columns 2017, 2018 and 2019:
So far I have:
->query("SELECT DISTINCT
      vtiger_potentialscf.cf_886 AS 'Years',

     vtiger_potentialscf.cf_1006 AS 'Potentials_Request_Source',
(CASE WHEN vtiger_potential.related_to NOT LIKE '' THEN (CASE WHEN trim(vtiger_accountPotentials.accountname)

NOT LIKE '' THEN trim(vtiger_accountPotentials.accountname) ELSE '' END) ELSE '' END) AS 'Potentials_Related_To',
vtiger_potentialscf.cf_926 AS 'Potentials_Brand_/_Title',
vtiger_potential.amount AS 'Potentials_Amount',
vtiger_crmentity.crmid AS 'Potentials_LBL_ACTION' from vtiger_potential inner join vtiger_crmentity on vtiger_crmentity.crmid=vtiger_potential.potentialid inner join vtiger_potentialscf on vtiger_potentialscf.potentialid = vtiger_potential.potentialid left join vtiger_account as vtiger_accountPotentials on vtiger_potential.related_to = vtiger_accountPotentials.accountid left join vtiger_groups on vtiger_groups.groupid = vtiger_crmentity.smownerid left join vtiger_users on vtiger_users.id = vtiger_crmentity.smownerid WHERE vtiger_potential.potentialid > 0 AND vtiger_crmentity.deleted=0
  ")
        ->pipe(new TimeBucket(array(
            "Years"=>"month"
        )))


        ->pipe(new Group(array(
            "by"=>"Years",
            "sum"=>"Potentials_Amount",
            "count"=>"vtiger_potential.potentialid"
        )))
and
<?php

    ColumnChart::create(array(
        "title"=>"Opportunities by Source",
        "dataStore"=>$this->dataStore('sakila_rental'),
            "columns"=>array("Years","Potentials_Amount"),

    ));
    ?>
which gives me
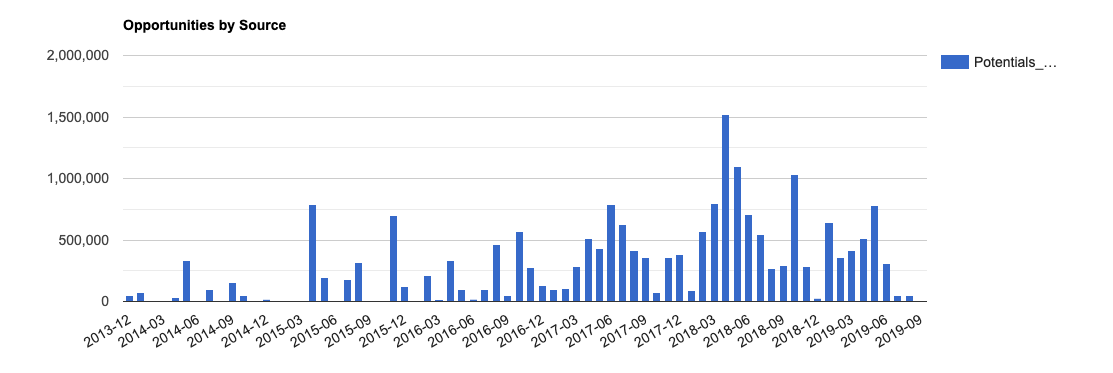
Can you please point me in the right direction to achieve what I want...
Thanks