KoolReport's Forum

Official Support Area, Q&As, Discussions, Suggestions and Bug reports.
Forum's Guidelines

Export PieChart Excel incomplete #1087

Open Seisk Agencia opened this topic on on Sep 17, 2019 - 7 comments

Seisk Agencia commented on Sep 17, 2019

Hi team.

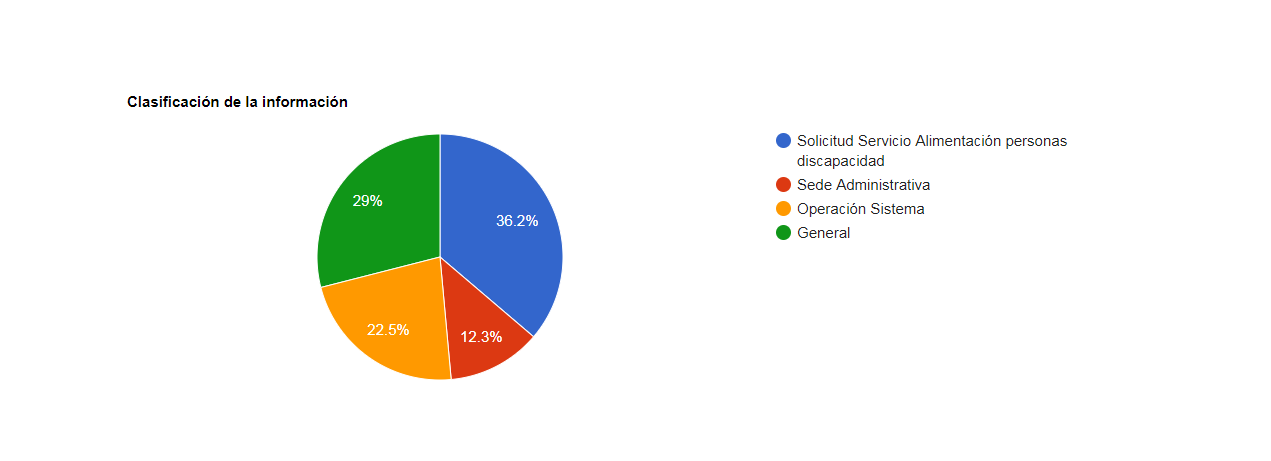
I have a situation when I'm trying to export to excel with charts. When I use my data and create a piechart in the browser, it looks like this (and it's correct):

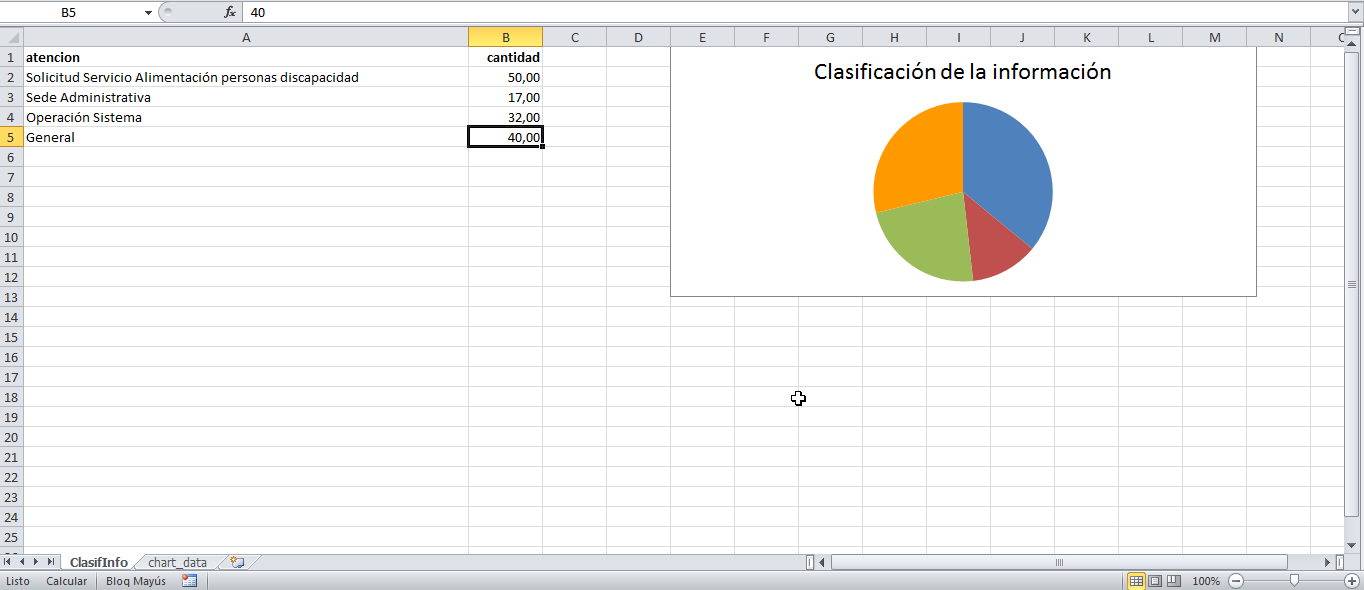
But when I try to use the same data to export a piechart in excel, it looks like this (incorrect):

The piechart only uses the first two rows, not the rest.

What could be the problem? Thanks a lot.

KoolReport commented on Sep 17, 2019

I have sent your case to dev.team to investigate issue further. I will keep you update.

David Winterburn commented on Sep 18, 2019

Hi Seisk,

Would you please post your php code for both the browser chart and the excel one for us to check it for you. Thanks!

Seisk Agencia commented on Sep 18, 2019

Of course. This is the browser code:

<?php

use \koolreport\widgets\koolphp\Table;
use \koolreport\widgets\google\BarChart;
use \koolreport\widgets\google\PieChart;
use \koolreport\widgets\google\ColumnChart;

?> <?php

PieChart::create(array(
    "title"=>"Clasificación de la información",
    "dataSource"=>$this->dataStore('clasificacion_informacion'),
    "columns"=>array(
        "atencion"=>array(
            "label"=>"Tipo de Atención para Información"
        ),
        "cantidad"=>array(
            "type"=>"number",
            "label"=>"Cantidad"
        )
    )
));

?>

And this is the excel code:

<?php

use \koolreport\excel\Table;
use \koolreport\excel\BarChart;
use \koolreport\excel\PieChart;
use \koolreport\excel\LineChart;

$sheet1 = "Clasificacion Informacion";

?> <div sheet-name="ClasifInfo">

<div>
    <?php
        Table::create(array(
            "name"=>'clasificacionInformacion',
            "dataSource"=>'clasificacion_informacion'
        ));
    ?>
</div>
<div range="E1:N13">
    <?php
        PieChart::create(array(
            //'excelDataSource'=>'clasificacionInformacion'
            'title'=>"Clasificaci贸n de la informaci贸n",
            'dataSource'=>'clasificacion_informacion',
            /*"columns"=>array(
                "atencion"=>array(
                    "label"=>"Tipo de Atenci贸n para Informaci贸n"
                ),
                "cantidad"=>array(
                    "type"=>"number",
                    "label"=>"Cantidad"
                )
            )*/
        ));
    ?>
</div>

</div>

Thanks a lot.
David Winterburn commented on Sep 20, 2019

Hi Seisk,

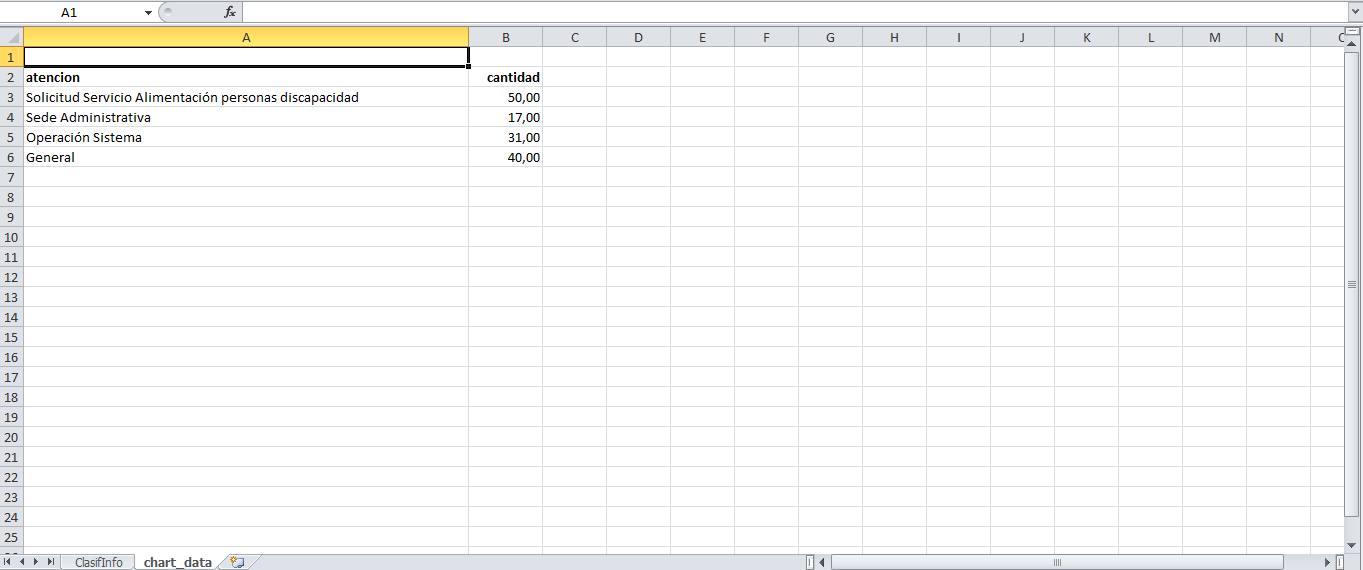
Would you please check if your export excel file has a sheet called chart_data. If there's one, please see if there's the table clasificacion_informacion with full data rows there or only the first 2 rows? Thanks!

Seisk Agencia commented on Sep 21, 2019

Hi.

Yes, I found the sheet and the table. Here's the screenshot:

Thanks.

David Winterburn commented on Sep 23, 2019

Hi Seisk,

Would you please open the file excel/Table.php and replace the following line:

    'bottomRight' => count($expColKeys) . ":" . ($rowOrder - 2),

with this:

    'bottomRight' => ($startCol + count($expColKeys) - 1) . ":" . ($rowOrder),

Then try exporting to Excel again and let us know if it solves your problem. Thanks!

Seisk Agencia commented on Oct 3, 2019

Good morning.

Thanks a lot, that solved my problem.

Now there is another question, but I don't know if I should use this post or a new one. Is there a way for the piechart to look exactly like the one in the browser? At least with the annotations and numbers. Thanks in advance.

Build Your Excellent Data Report

Let KoolReport help you to make great reports. It's free & open-source released under MIT license.

Download KoolReport View demo
None yet

None